As a QuickBooks ProAdvisor®, I’ve worked with numerous mid-market business owners who use the reporting capabilities of QuickBooks® Enterprise to help take their business to the next level. Your financial reports tell you a lot about your business. QuickBooks Enterprise includes hundreds of commonly requested reports that will allow you to see the data you want and how you want it, with customizable, built-in reports. Or, you can simply create your own reports from scratch.
If you are not sure where to start, let’s take a look at the robust Report Center, where you can find my favorite four reports I teach my clients to run and review on a regular basis.
What you need to know about the Report Center
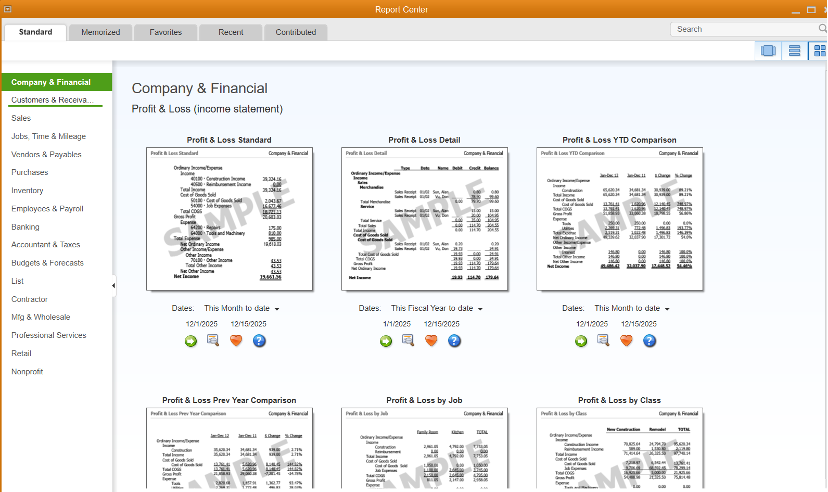
The Report Center is located by selecting the Reports menu in the top navigation bar, and then choosing Reports. From here, you will find five tabs outlining 165 industry specific reports:
Standard: Reports are grouped in this tab by category. You will see a sample of the report with the following icons below it.
Memorized: Reports you previously memorized.
Favorites: Reports you previously marked as a favorite.
Recent: Reports ran today, in last 30 days, and those older than 90 days.
Contributed: Reports shared by other QuickBooks users, ProAdvisors, and accountants.
The following four icons are under listed under reports:
Run: Runs the report.
Info: Gives you a description of the report.
Heart: Saves the report as a favorite.
Question mark: Opens the help window with more information on reports.
Most of the reports allow you to run either in a summary or detailed version:
Summary reports are designed to provide information about customers, sales, expenses, and more. Transactions are grouped together and only reflect a summarized number.
Detailed reports provide detailed transactional information about customers, sales, expenses, and more. Transactions are listed independently so you can see everything that makes up the total amount.
My 4 favorite reports
#1: Profit & Loss (Reports > Company & Financial > Profit & Loss Summary)
A Profit & Loss (P&L) report shows how much money your business made and spent over a specific period of time. This report consists of three parts: revenue, expenses, and net income or loss. If your revenue is higher than your expenses, you have a net income. If your expenses are higher than your revenue, you have a net loss.
Typically, you would run the P&L report monthly, quarterly, or annually. However, you may want to compare your business this year to a previous period with a month-to-month comparison, or even run a year-to-date comparison just to see how your company stands at a given point in time.
I find the P&L useful to point out two critical components to my clients:
Static sales: Most companies want to grow. So, if you see your revenue declining or even flat from month to month, you will need to revisit your product and marketing plan.
Declining profits: Your profits should rise along with an increase in sales. If your sales are going up, but profits are going down, then you need to figure out why. Review your direct costs or overhead to figure out why you are not more profitable.
#2: Balance Sheet (Reports > Company & Financial > Balance Sheet Summary)
A Balance Sheet provides a picture of what your business owns (assets), what your company owes (liabilities), and your company’s equity (book value of your business) at a certain point in time. It consists of three parts: assets, liabilities, and equity. I teach my business owners to review this report monthly to ensure that there are no errors, such as negative receivables or incorrect loan balances.
#3: A/R Aging Summary (Reports > Customers & Receivables > A/R Aging Summary)
The Accounts Receivable (A/R) Aging Summary report is essential for any business that extends credit to its customers. This report shows a snapshot of each of your customer’s balances by age of the invoice. The balances are broken into columns for current, 30, 60, 90, and over 90 days or more.
This report is the easiest way to track and ensure your customers pay you on time. In addition, regularly reviewing this report allows you to stay on top of our outstanding invoices, and enables you to know which customers to reach out to with a reminder email, statement, or even finance charges for not paying on time.
#4: A/P Aging Summary (Reports > Vendors & Payables > A/P Aging Summary)
The Accounts Payable (A/P) Aging Summary report is essential for any business regardless of what service or product you sell. This report summarizes the status of unpaid bills in accounts payable, showing what you owe, who you owe it to, and how much is overdue. Reviewing your A/P Aging report on a regular basis will help you manage your cash flow, while keep your vendors happy.
For example, you can use this report to determine which vendors need to be paid right away, and which ones can be paid later when you have more money in the bank. The balances are broken into columns for current, 30, 60, 90, and over 90 days or more. This report is also a great tool for negotiating extended or different payment terms with vendors as needed.
Don’t forget about customized reports
Regardless of the type of business your run, the right reports are crucial in giving you a better understanding of your financial position. Remember, too, that you can customize reports to give you greater insight into many parts of your business; your QuickBooks Enterprise advisor can help you understand these insights and guide you to success.
While it may take some time to get used to running and reading financial reports, once you do, you will be able to take your business to the next level.
The post My 4 favorite reports in the QuickBooks Enterprise Report Center appeared first on QuickBooks.


